

MPTonline.com is the web-based application for professional investors. Market Profile Theorems, Inc. has been a provider of Behavioral Financial models, integrating Insider, Earnings, Technical and Style aspects, for over 29 years. The behavioral approach to equity selection provided by MPT adds unique insights to the equity selection process, and compliments more traditional fundamental tools. Coverage has averaged over 5000 U.S. companies, with aggregated views on 16 Economic Sectors and 59 Industries, and Top-down Strategic views on the broader market. The work is therefore useful for both "bottom-up" and "top-down" applications. The combination of non-correlated MPT models allows for sufficient risk control in the process to allow equity portfolio managers to run money using this powerful suite of tools alone, while at the same time allowing for integration of existing models favored by the user.
The MPT research display features are designed to improve the decision-making process. One example of this is our presentation of the 4 basic MPT models, (Insider, Earnings, Technical, and Summary), in the context of a probability matrix defined by past model scores for each Company, Industry, and Sector we monitor. Another feature is the color-coded 28-month time series for each model - revealing significant changes in each model at a glance. A more specific description of the concept, methodology, and use of the various behavioral perspectives we provide, can be found by clicking on the individual tabs for each model found at the top of this page. The underlying data and graphics are available only to subscribers to MPT research.
We view Corporate Insider behavior as a subset of Behavioral Finance. While in and of itself Insider activity can be useful in adding to the decision making process, it can also be thought of as the initial starting point in a decision tree of information which includes other important inputs such as Analyst Behavior, Market Style (Value/Growth, Large/Small-cap), and Relative Price Strength driven by the market trading mechanism itself.Behavioral Finance & Corporate Insider activity – Point of Departure. At Market Profile Theorems we use Behavioral Theory in a sequential "waterfall" manner – looking for confirmation of positive events at the Insider level (Market or Self-relative), from the analyst community, or in price movement itself. Positive or negative events at the initial, Insider level, of analysis can manifest themselves in terms of “Change”, and “Out of Range Behavior”.
The MPT model of Insider Behavior is a 7-factor model - incorporating finely tuned weightings for: Selling and Buying; Transaction size; Transaction date relative to current; Options-related transactions; Historical company behavior; Insider position and; Initial transactions - is not a retro-fitted theoretical model, but has been produced "live" and used by the professional money management community for 24 years. Past performance spreads - between companies ranked best and those ranked worst – have clearly been positive over the period the research has been live.
An corollary to the theory is found in the aggregation of Insider behavior by Industry or Economic Sector. The advantage of cumulative data points amongst aggregation of like-companies provides additional statistical confidence in the behavior observed in this Insider model of robust design. In this approach, Analyst and Market pricing behavior is also aggregated in order to develop a sense of the larger picture.
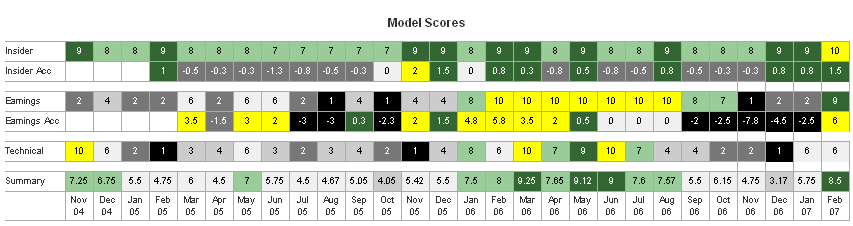
The following graphic example (Model Scores) provides a dynamic picture of change in MPT Earnings, Insider, Technical and Summary model scores over the past 28 months, with the most recent data point (January 26th 2007) to the right. The Yellow squares reflect the most positive scores in the key models, with Black signifying the most negative conditions. Color gradients from Dark Green to Gray are included. Numeric scores are provided as well. These plots are available for our coverage universe of over 5,000 Companies - which values are aggregated upward through 16 Economic Sectors, and 59 Industry Groups.
Probability Plots, and the Informational Hierarchy. It is one thing to have access to information; another to model it in a cohesive, and actionable manner; and yet another to actually “see” the data in a meaningful context. The graphic provided by the MPT Probability Plot allows visualization of not only Market Relative and Self Relative behavior, but the interaction of a given set of related behavioral inputs as well.
The following graphic illustrates these points. To orient you, the view reveals scores for 4-MPT Behavioral model inputs: Insider (I), Earnings (E), Relative Price Strength (T); and Summary (S) - (the latter combining all models into one).
 The highest scores for each model are located at the outside of each model arm and the lowest to the middle. The grey shaded area represents the “normal” range for each model. The red dot reveals the current model score for each variable. A score toward the center, white area, indicates out of range behavior in a negative direction. Think of the connections between current values for all four models as creating the red, shaded overlay on the normalized outcomes. Using this view, one is able to instantly ascertain the condition of the company, industry or sector relative to both other companies, and to itself. In this example, we note that not only is the current Insider model score for the company at the low end of scores for all companies, but it is below the normalized range for the company itself. This is a warning flag. The Probability Plot includes strong scores for both Earnings and Summary models, and their combination with the Insider profile would force us to become "sensitized" and focus on potential upcoming negative changes in analyst estimates and/or Earnings Surprise.
To reiterate, Interaction amongst the various behavioral models is an important feature of our approach. In the MPT view, and after working with this concept for 23 years, we have found that the information flow moves from the Insider signal through Earnings, and is expressed either coincidently or shortly thereafter through a market pricing response. The arrow in the graphic illustrates this flow. Another term we use is that of a “Behavioral Market Clock” , with the Insider input located at the starting, 12 O’clock postion. As illustrated in the example, an adequate Insider "signal" should cause the practitioner to begin focusing on earnings revisions for signs of movement in the same direction implied by Insider behavior. Managers basing their investment decisions on Value or GAARP should be particularly interested in this type of modeling, as it has the potential for improving the timing of longer-term entry and exit points.
Applying this approach to the concept of a “Market Clock”, and beginning with Insider change, by the time the model score improvement gets around to the Summary model (S), all models have kicked into gear - followers of Insider behavior, Earnings models (revisions and surprise), and Price Momentum, are all “on-board” - and the share price has accelerated significantly.
In the final analysis, the basis for our work is the principle that in a well-designed model, Corporate Insiders – whether by action or inaction – buying or selling – provide initial clues as to how they perceive the relative attractiveness of their own company shares. These clues gain cachet through an Insider's proximity to corporate developments, training, and the wherewithal to act. They have tended to be correct and serve as primary nodes in our particular Behavioral model – more often than not leading both the analyst community and price direction.
We hope you find the advanced features provided in this on-line version of the MPT data a useful resource. We welcome commentary and look forward to visiting each of you over the coming months to present applications of our extremely exciting new perspective.